The State of Carbon Dioxide Removal (2nd edition)
The work for the second edition of the global assessment of the state of carbon dioxide removal builds on the efforts made for the first edition, including the creation of a complete visual identity for the project and the co-design of signature figures for the executive summary.

The State of CDR reports are intended to regularly inform researchers, policymakers and practitioners on the state of Carbon Dioxide Removal (CDR), by systematically collecting and analysing the vast amount of data and developments in many parts of the world.
The project is led by leading academics Oliver Geden (German Institute for International and Security Affairs, SWP), Matthew J. Gidden (International Institute for Applied Systems Analysis, IIASA), William F. Lamb (Mercator Research Institute on Global Commons and Climate Change, MCC), Jan C. Minx (Mercator Research Institute on Global Commons and Climate Change, MCC), Gregory F. Nemet (University of Wisconsin-Madison) and Stephen M. Smith (University of Oxford).
The second edition continues the assessment of CDR development, expanding geographical coverage and including new topics such as voluntary markets and monitoring, reporting and verification. Authors of the report have compiled data on a number of Key Indicators of the State of CDR. These indicators showcase the current state of play, direction of travel, and benchmarks for future CDR needs consistent with sustainably limiting temperature increase in line with the Paris Agreement.

Front cover of the second edition of the State of Carbon Dioxide Removal report, published in 2024

Back cover of the second edition of the State of Carbon Dioxide Removal report, published in 2024
The design work we did for the second edition, published in June 2024, builds on the efforts made for the first edition. This included creating a complete visual identity for the project and the reports, as well as co-designing signature figures for the executive summary and social media.
For the second edition, we focused on updating the four signature visualisation from the previous report with the latest data and facilitated the co-design process of a new signature figure. The co-design process requires facilitating design meetings with the scientists from the early stages, when the assessment is not final yet, throughout the phases of research, definition of the visualisation’s intent, prototyping, and finalisation.


The visualisations of the executive summary can be seen as milestones for dissemination and decision-making and they are co-designed in ongoing collaboration with the scientists. The visualisations are standalone and introduce key selected messages from the assessment but they also contribute to a unified narrative.
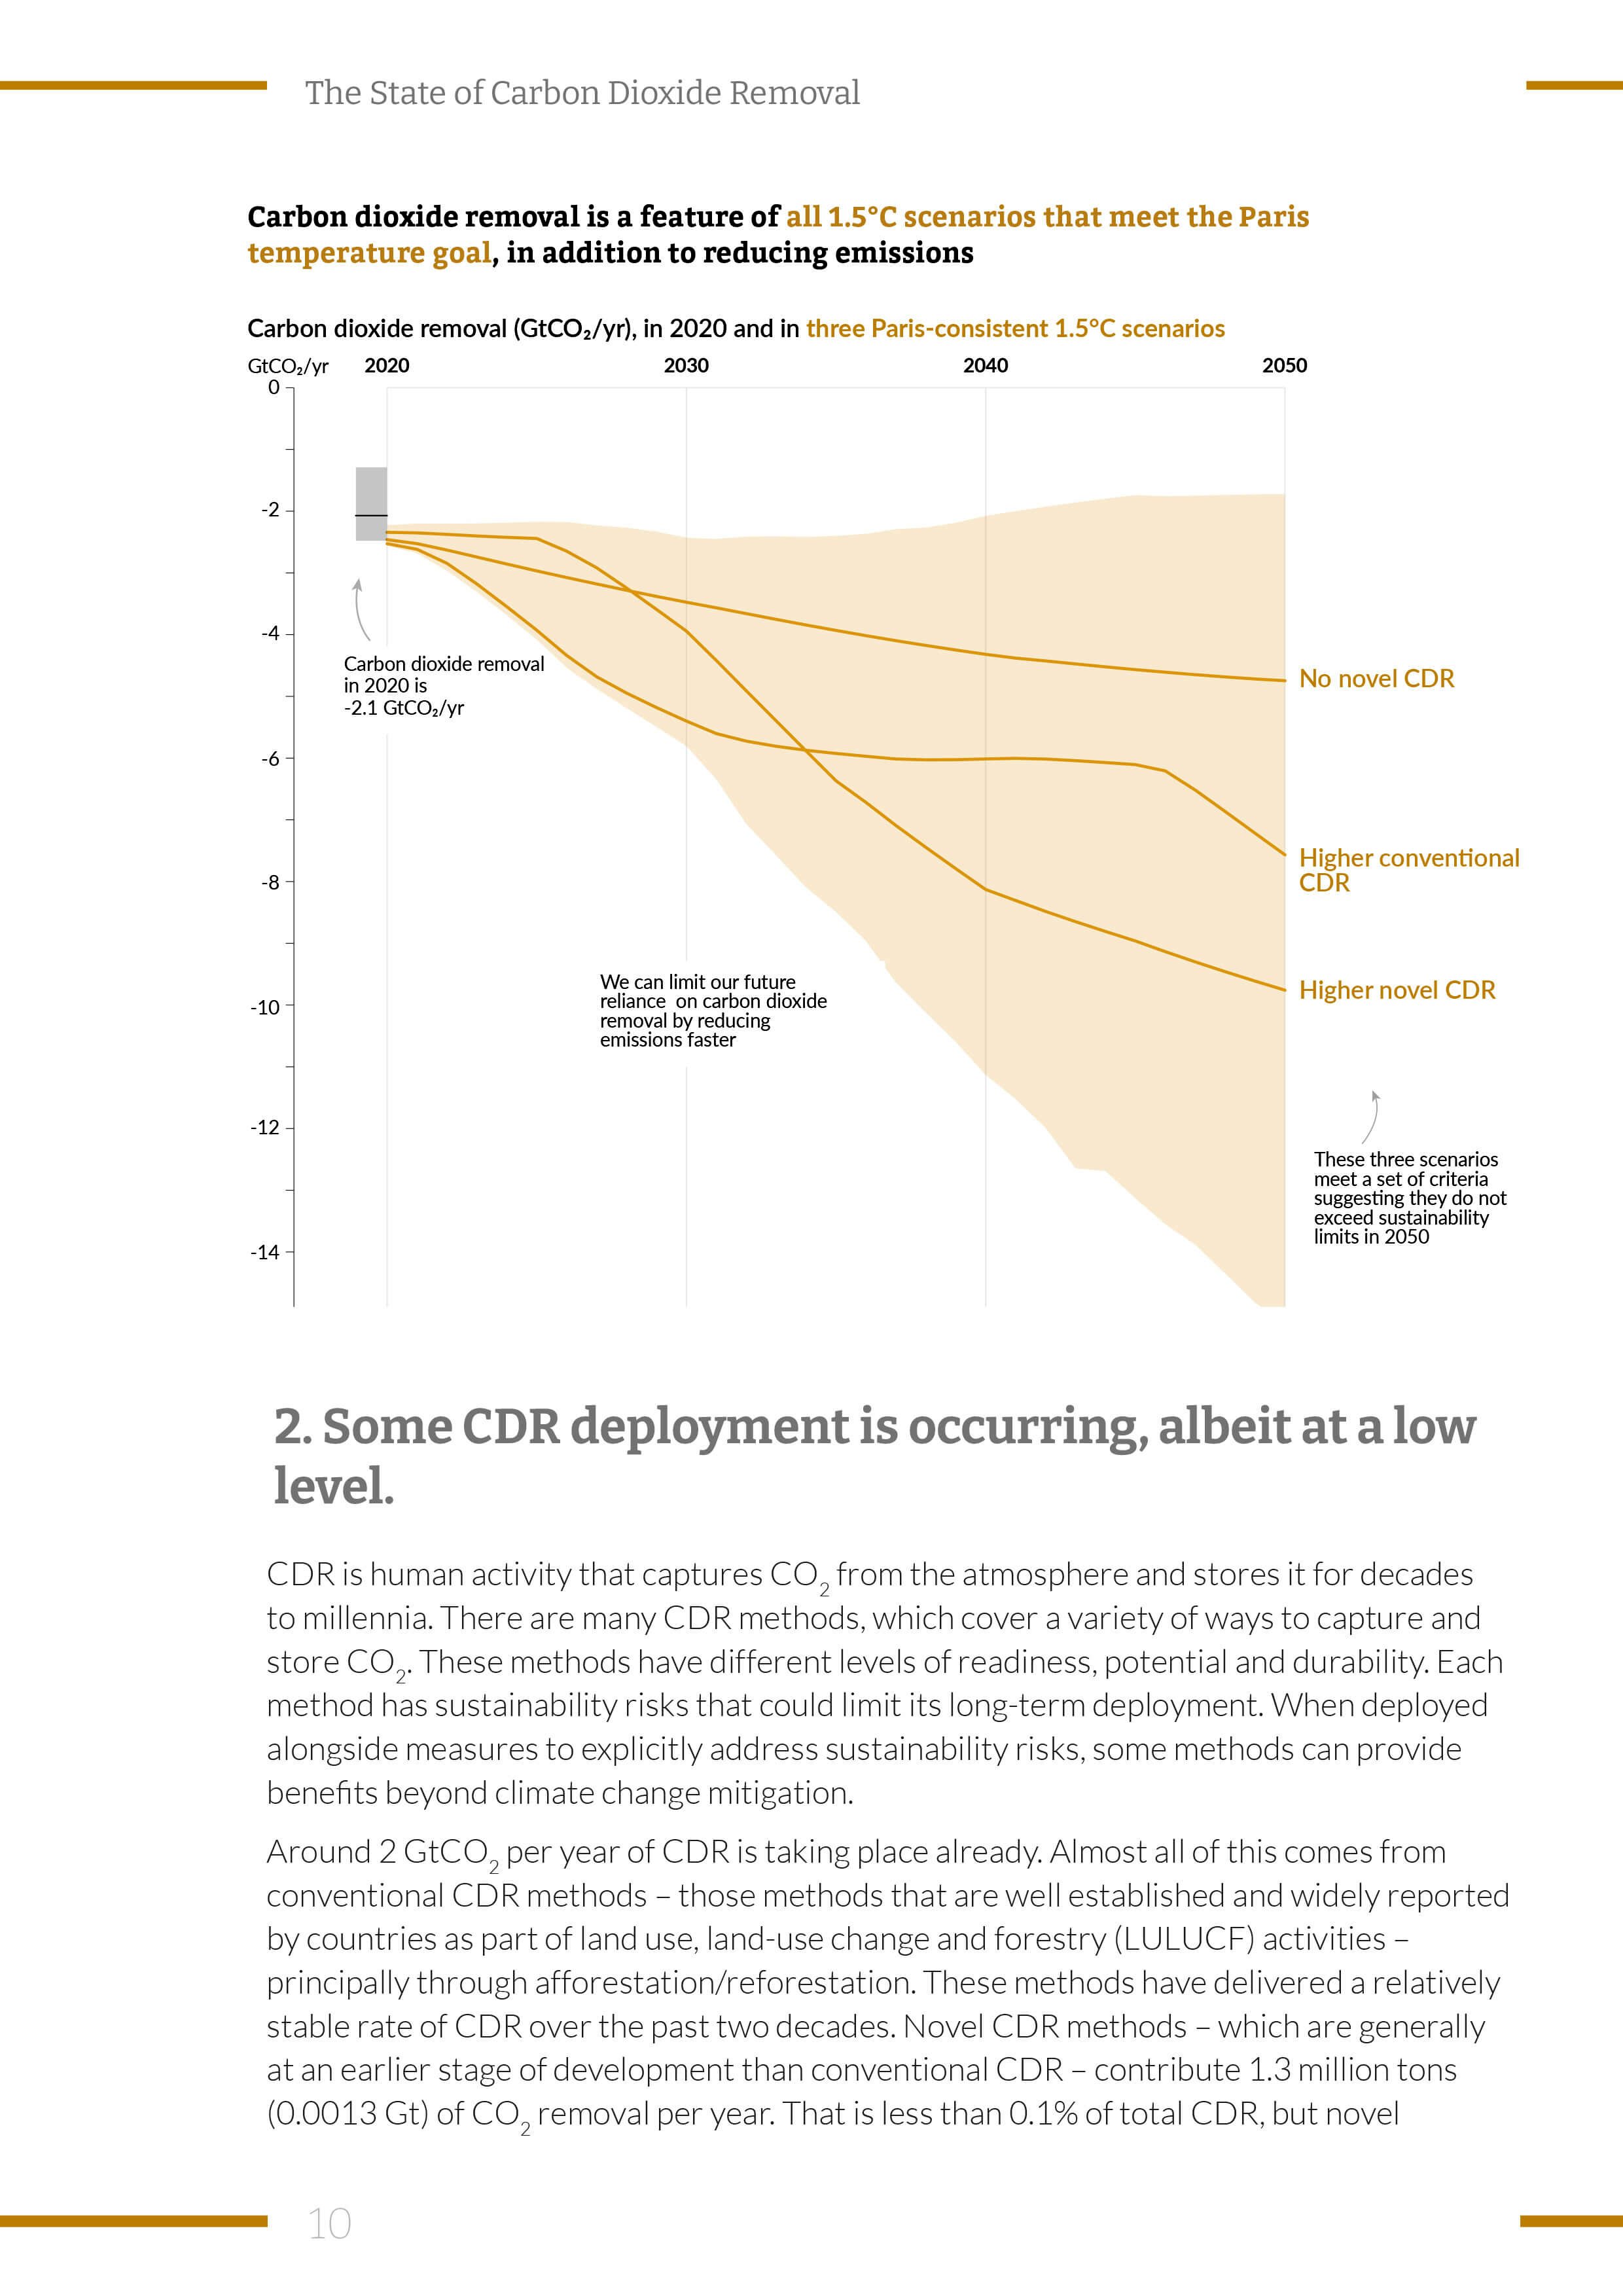
Visualisation 1: Carbon dioxide removal is a feature of all 1.5°C scenarios that meet the Paris temperature goal, in addition to reducing emissions. Meeting the Paris Agreement’s long-term temperature goal requires rapid greenhouse gas emission reductions and near-term scale-up of carbon dioxide removal (CDR).
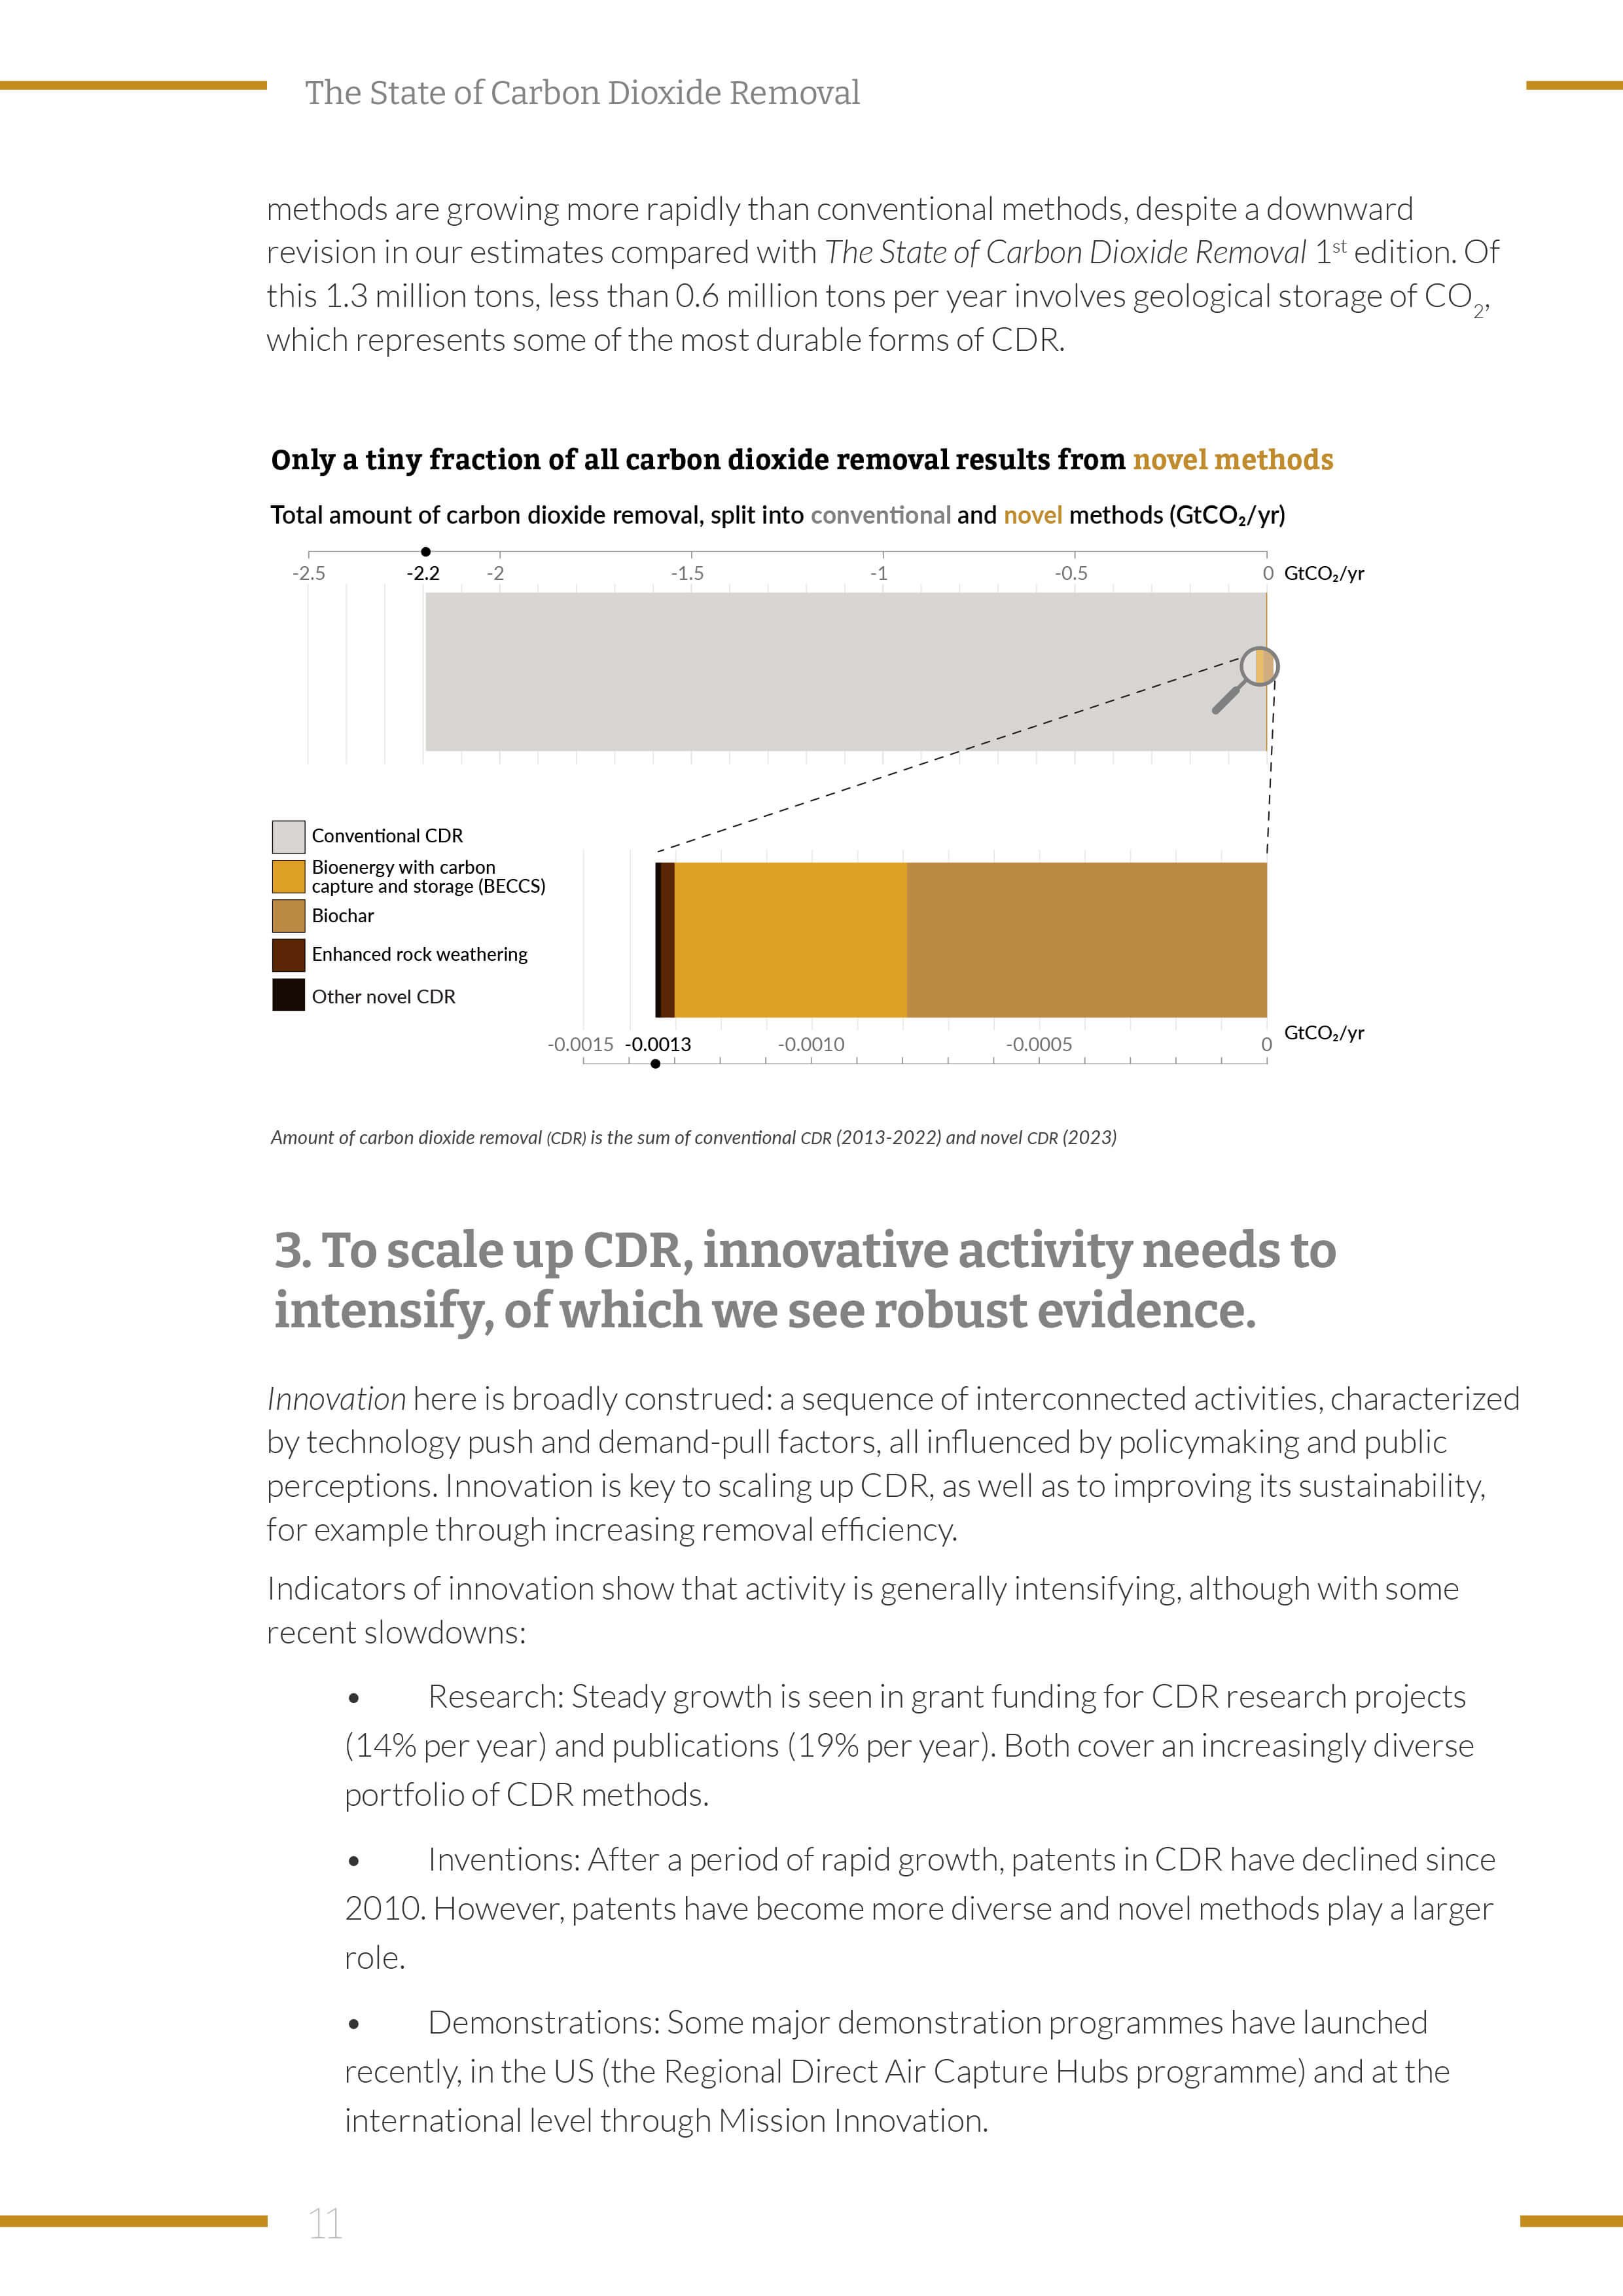
Visualisation 2: Only a tiny fraction of all carbon dioxide removal results from novel methods. Some CDR deployment is occurring, albeit at a low level.
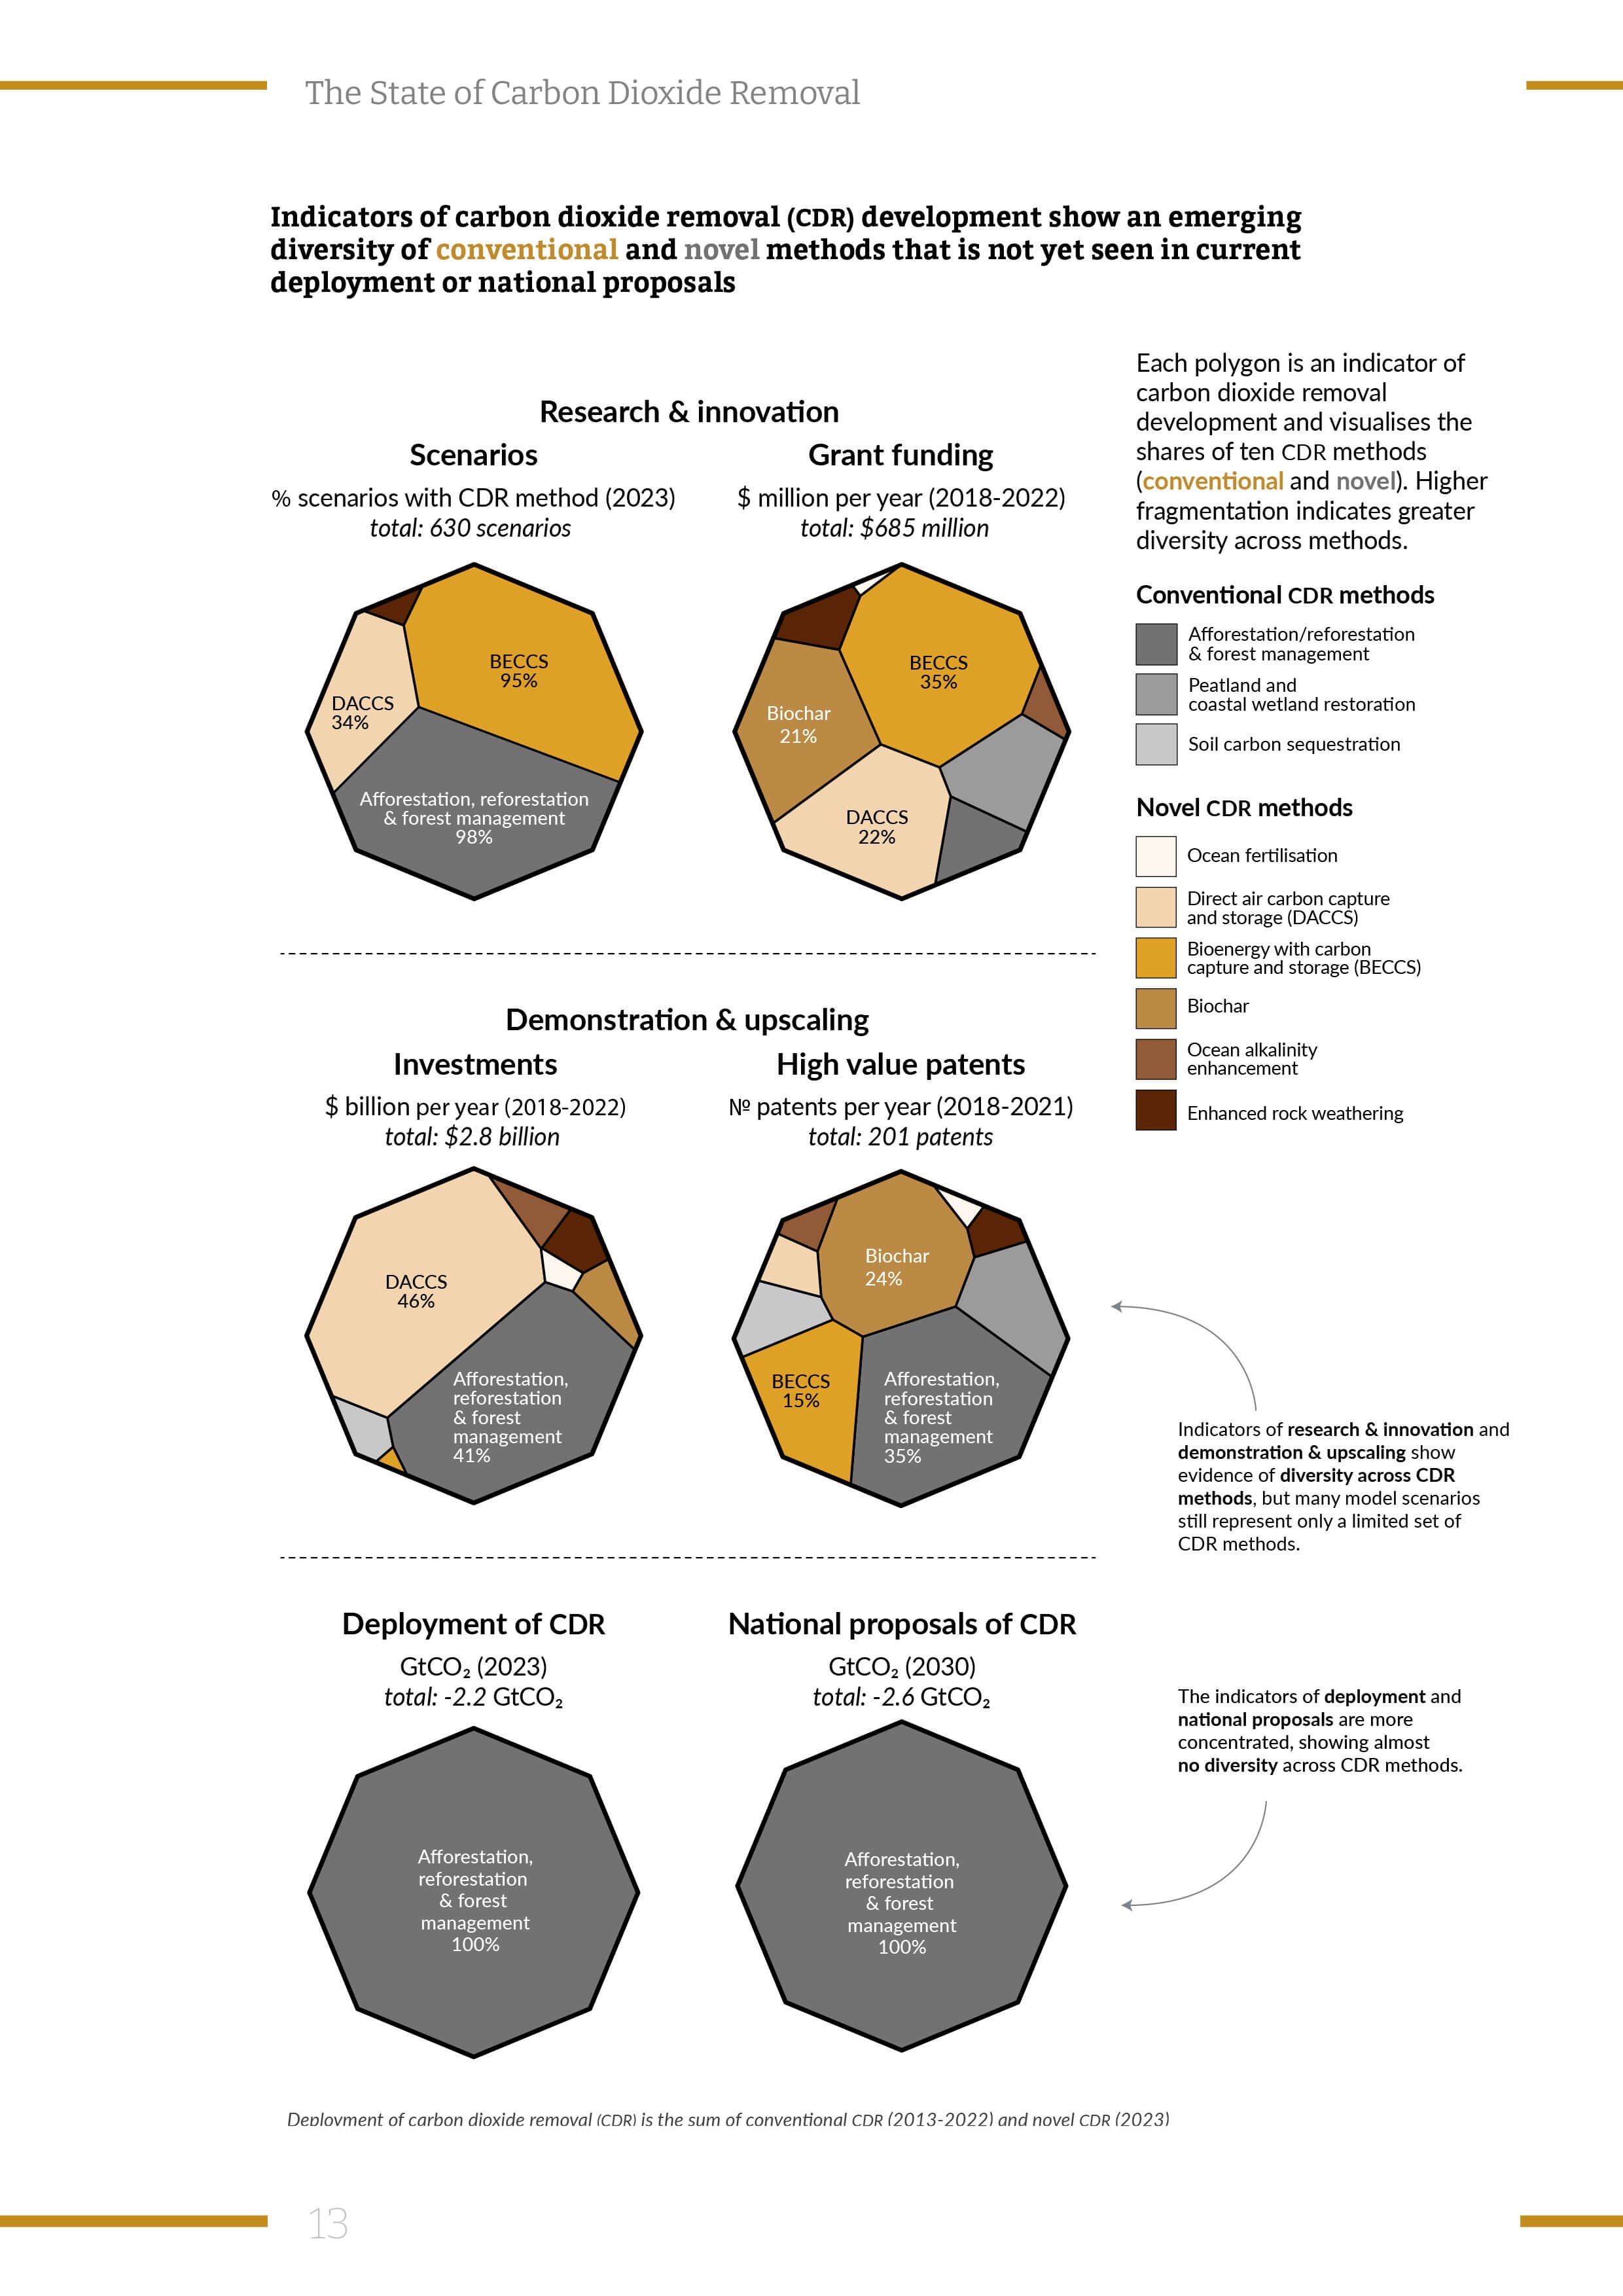
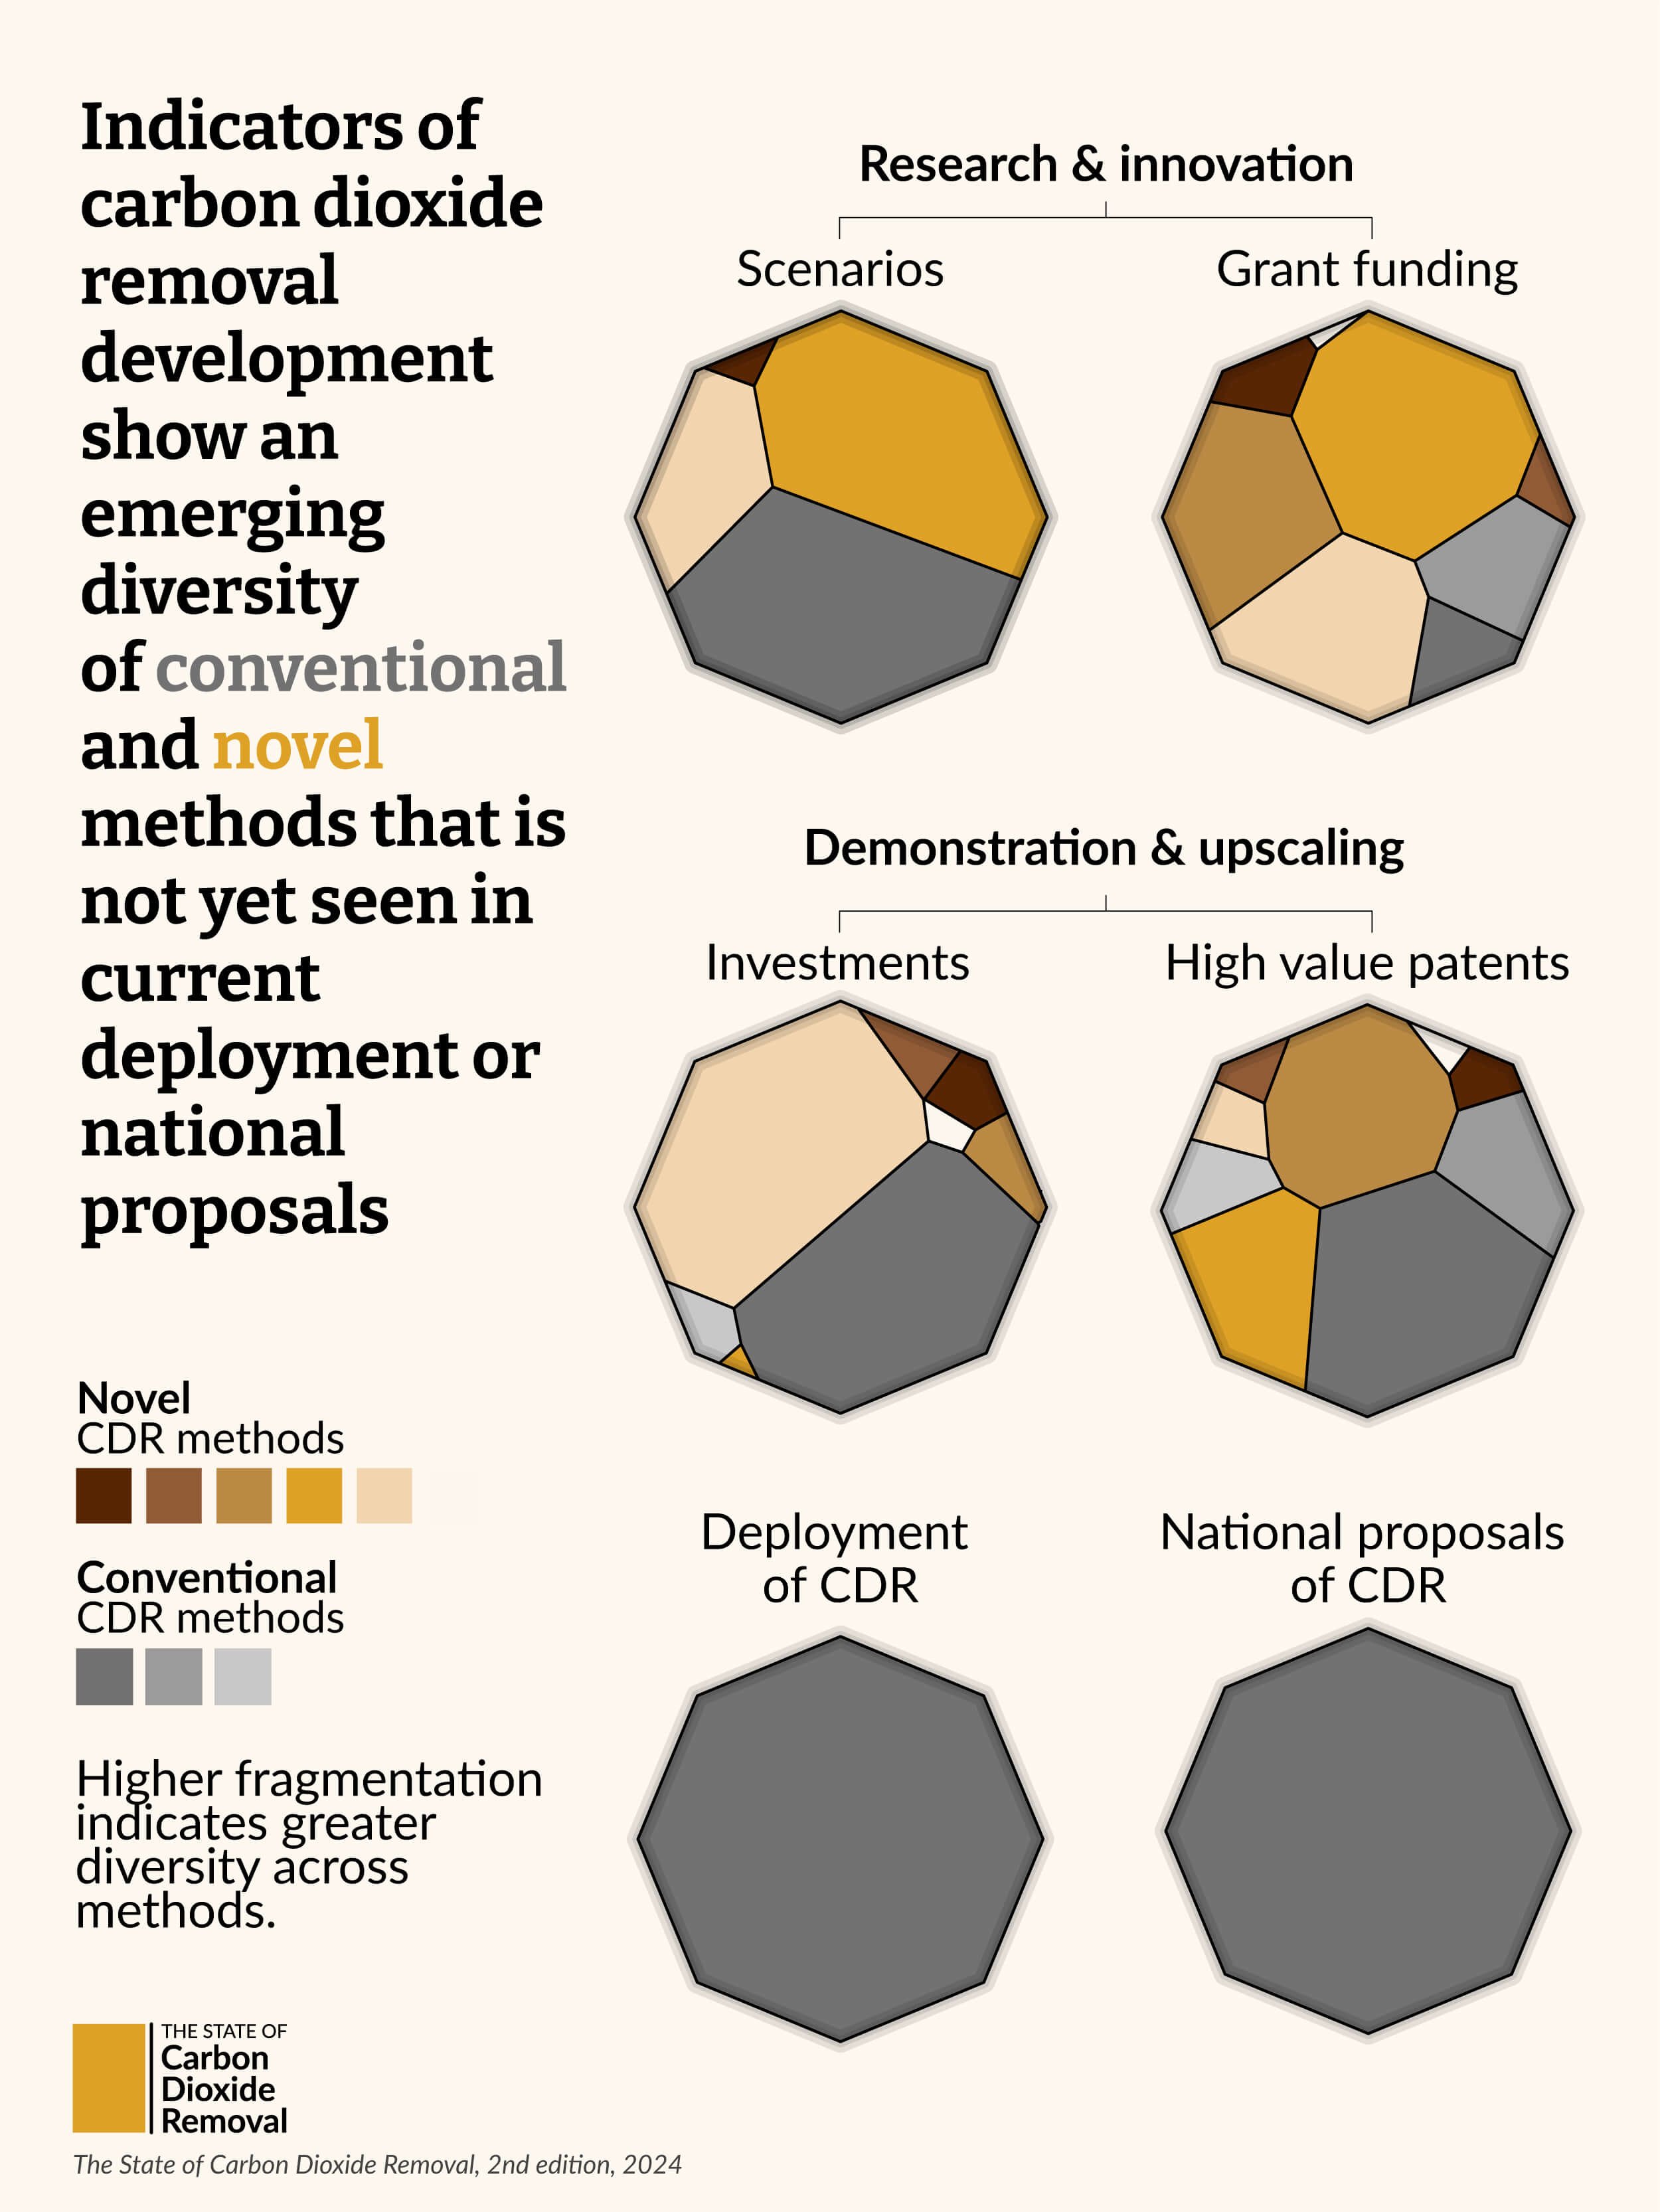
Visualisation 3 (new): Indicators of carbon dioxide removal development show an emerging diversity of conventional and novel methods that is not yet seen in current deployment or national proposals. To scale up CDR, innovative activity needs to intensify, of which authors see robust evidence.
Visualisation 4: There continues to be a gap between the amount of CDR in scenarios that meet the Paris temperature goal and the amount of CDR in national proposals. The amount of CDR proposed falls short of what is required to meet the Paris temperature goal – this is the CDR gap.

Visualisation 1: The State of Carbon Dioxide Removal 2024, Executive Summary

Visualisation 2: The State of Carbon Dioxide Removal 2024, Executive Summary

Visualisation 3: The State of Carbon Dioxide Removal 2024, Executive Summary

Visualisation 4: The State of Carbon Dioxide Removal 2024, Executive Summary
Diversification was a central theme of the second edition and it required a dedicated visualisation with a new design. Because CDR methods carry different risks and benefits, and because it is uncertain how much CDR will be needed, deploying a diverse portfolio of methods is a more robust strategy than focusing on just one or two methods.
The purpose of visualisation 3 was not to create a tool for exact comparison across different CDR methods but to highlight the presence or absence of diversification within conventional (grey) and novel (yellow, Marigold) carbon dioxide removal methods. Indicators of research, invention and investment in startup companies show evidence of diversification across CDR methods. However, current deployment and national proposals for future implementation are more concentrated on a few conventional methods.
A Voronoi treemap is a method of visualising hierarchical data where each cell represents a portion of the data, with the hierarchy encoded by the nesting of cells within each other. While the irregular shapes are not ideal for precise comparison, their strength lies in their novelty and unusual appearance, which can convey a pattern and attract attention. This is an important aspect to balance when creating visualisations for communication purposes.


Visualisation 1, social media version, The State of CDR 2024

Visualisation 2, social media version, The State of CDR 2024

Visualisation 3, social media version, The State of CDR 2024

Visualisation 4, social media version, The State of CDR 2024
