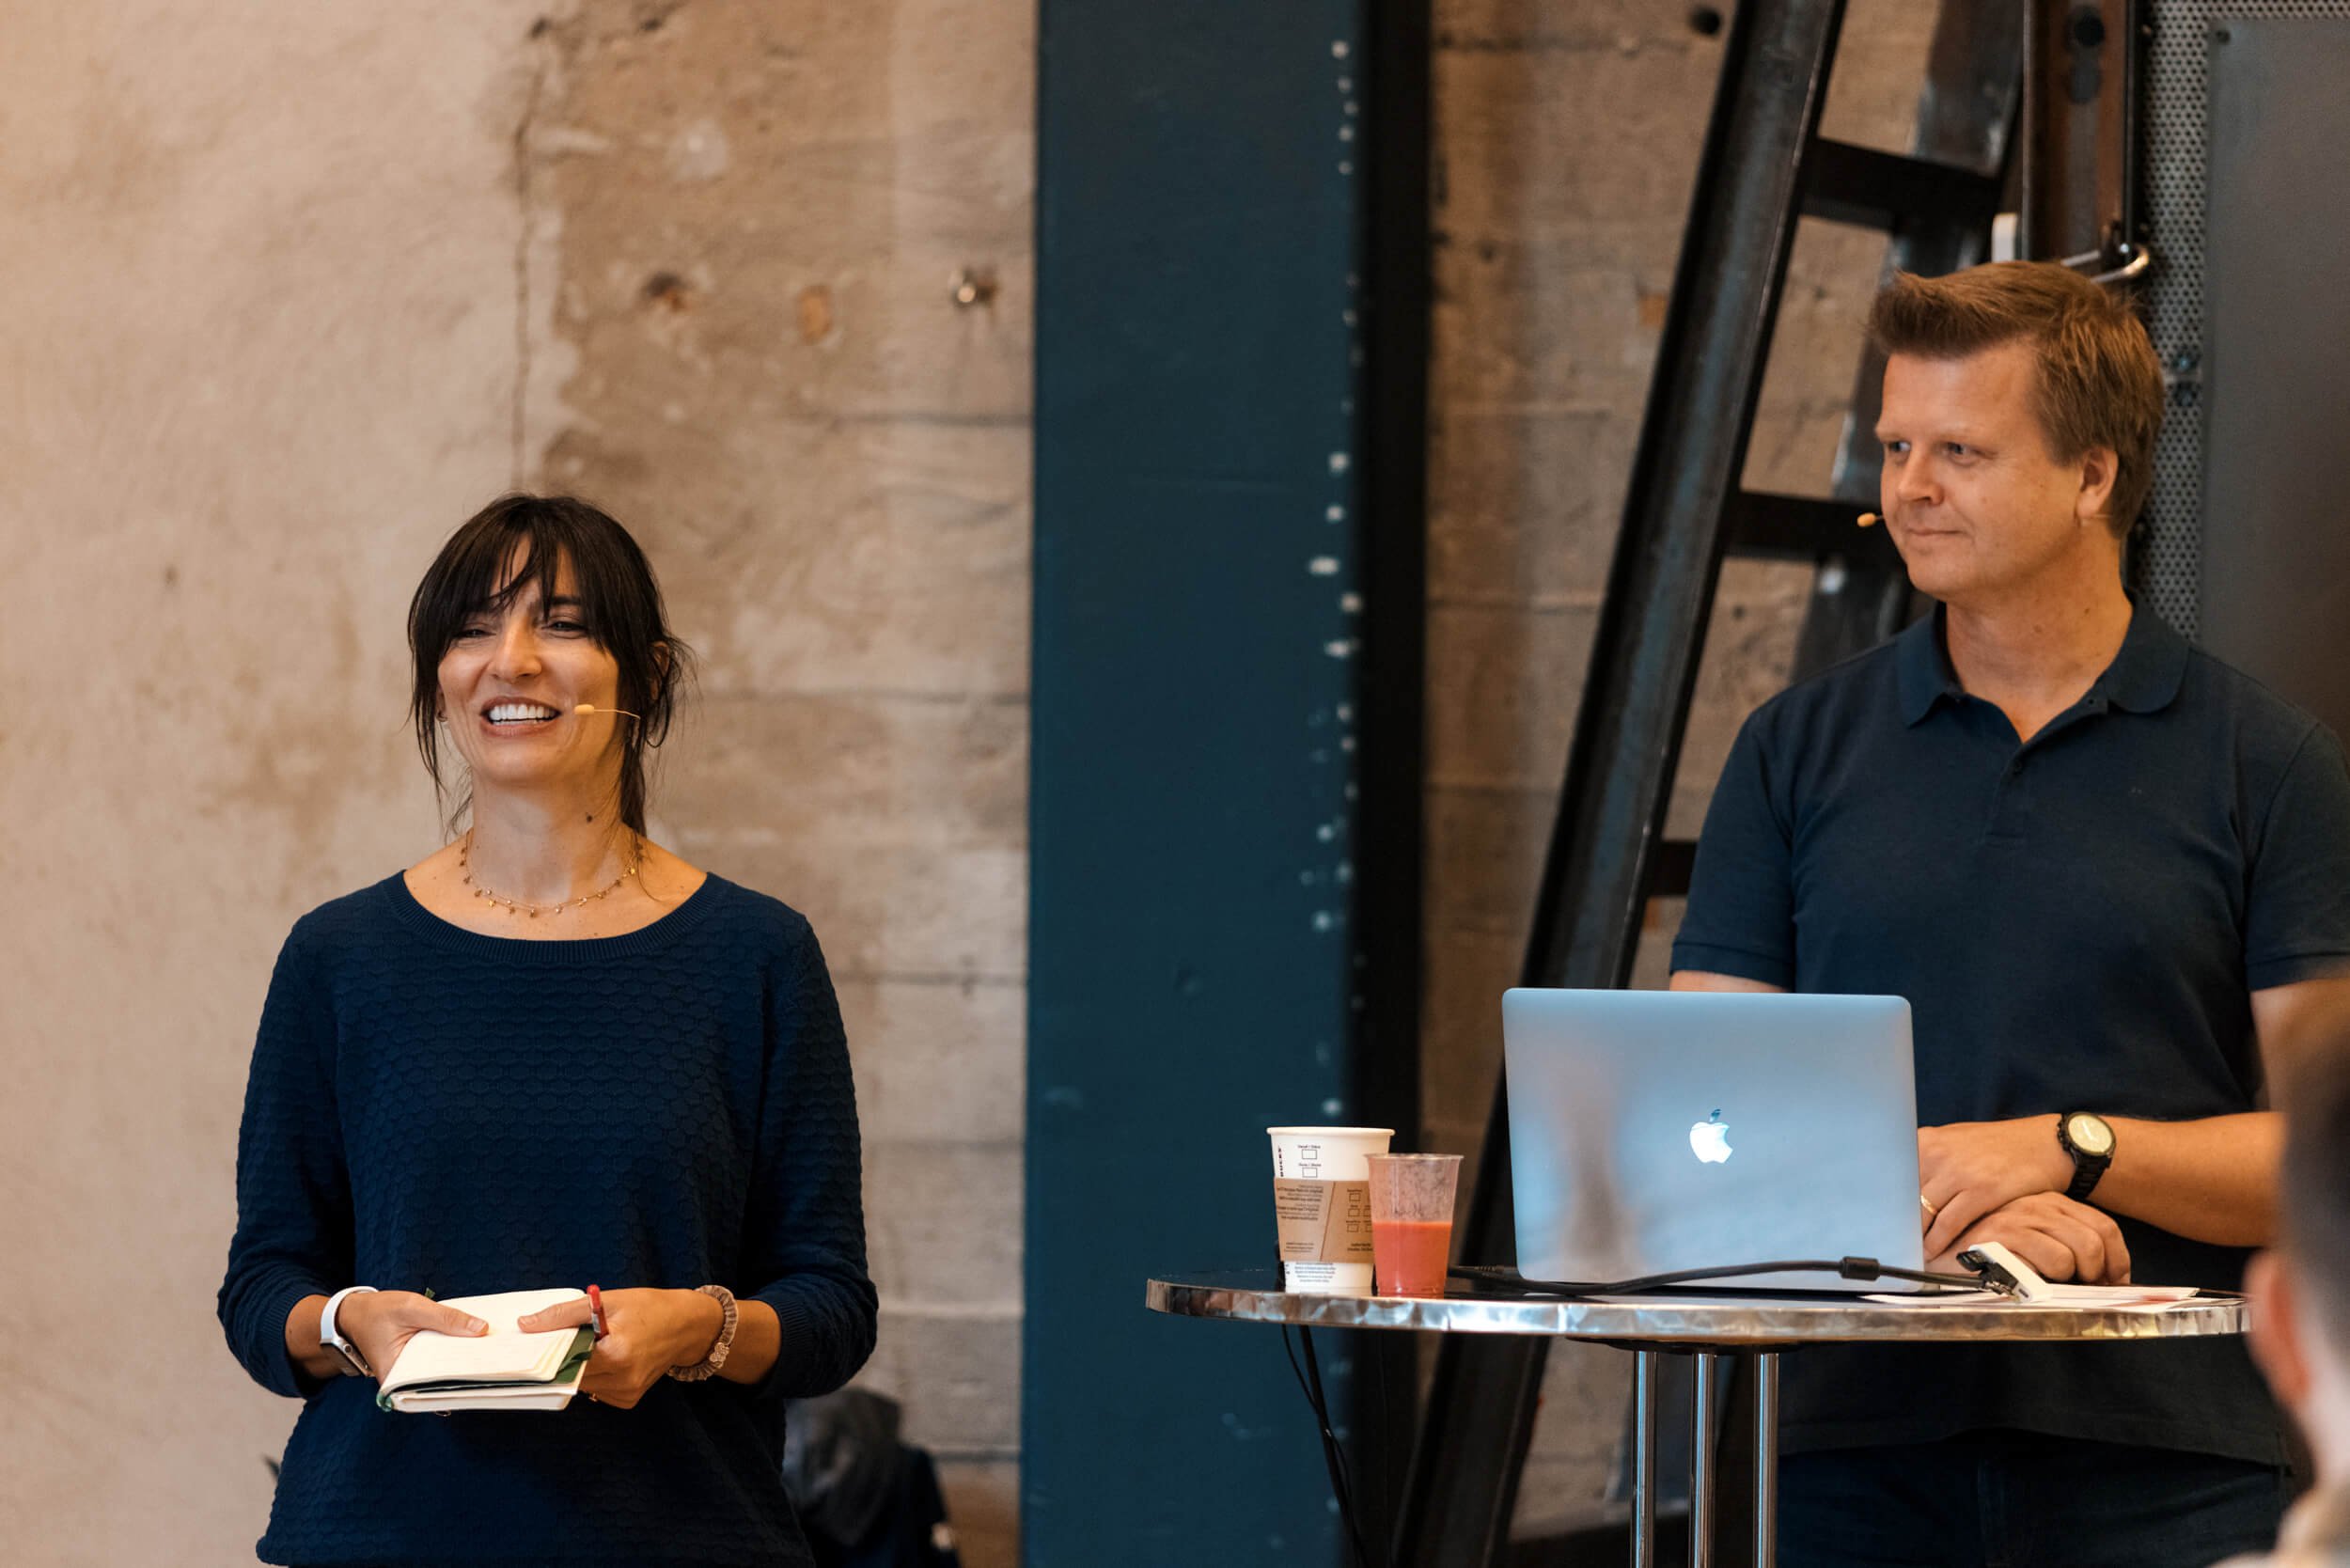
We are lecturers and international speakers and we run hands-on workshops for businesses and organizations who work in environments that require presenting information in effective and creative ways.
Talks serve as a means to inspire and share our co-design process through case studies, while workshops provide an immersive, hands-on experience to learn about the design tools we use in our projects.
In 2009 we established the very first short course in Information Design and Data Visualisation at Central St Martins University in London, we have been teaching that course for a decade until Brexit and Covid hit.
We teach at DOGA, The Norwegian Centre for Design and Architecture, and we are planning a new course scheduled for September 2023.
We have collaborated and run modules in Information Design at BA and MA level, within the Communication and Graphic Design path, at AHO, The Oslo School of Architecture and Design and Khio, the Oslo National Academy of the Arts. We have given courses at the Norwegian Institute of Journalism, Oslo Met and BI the Norwegian Business School in Oslo.
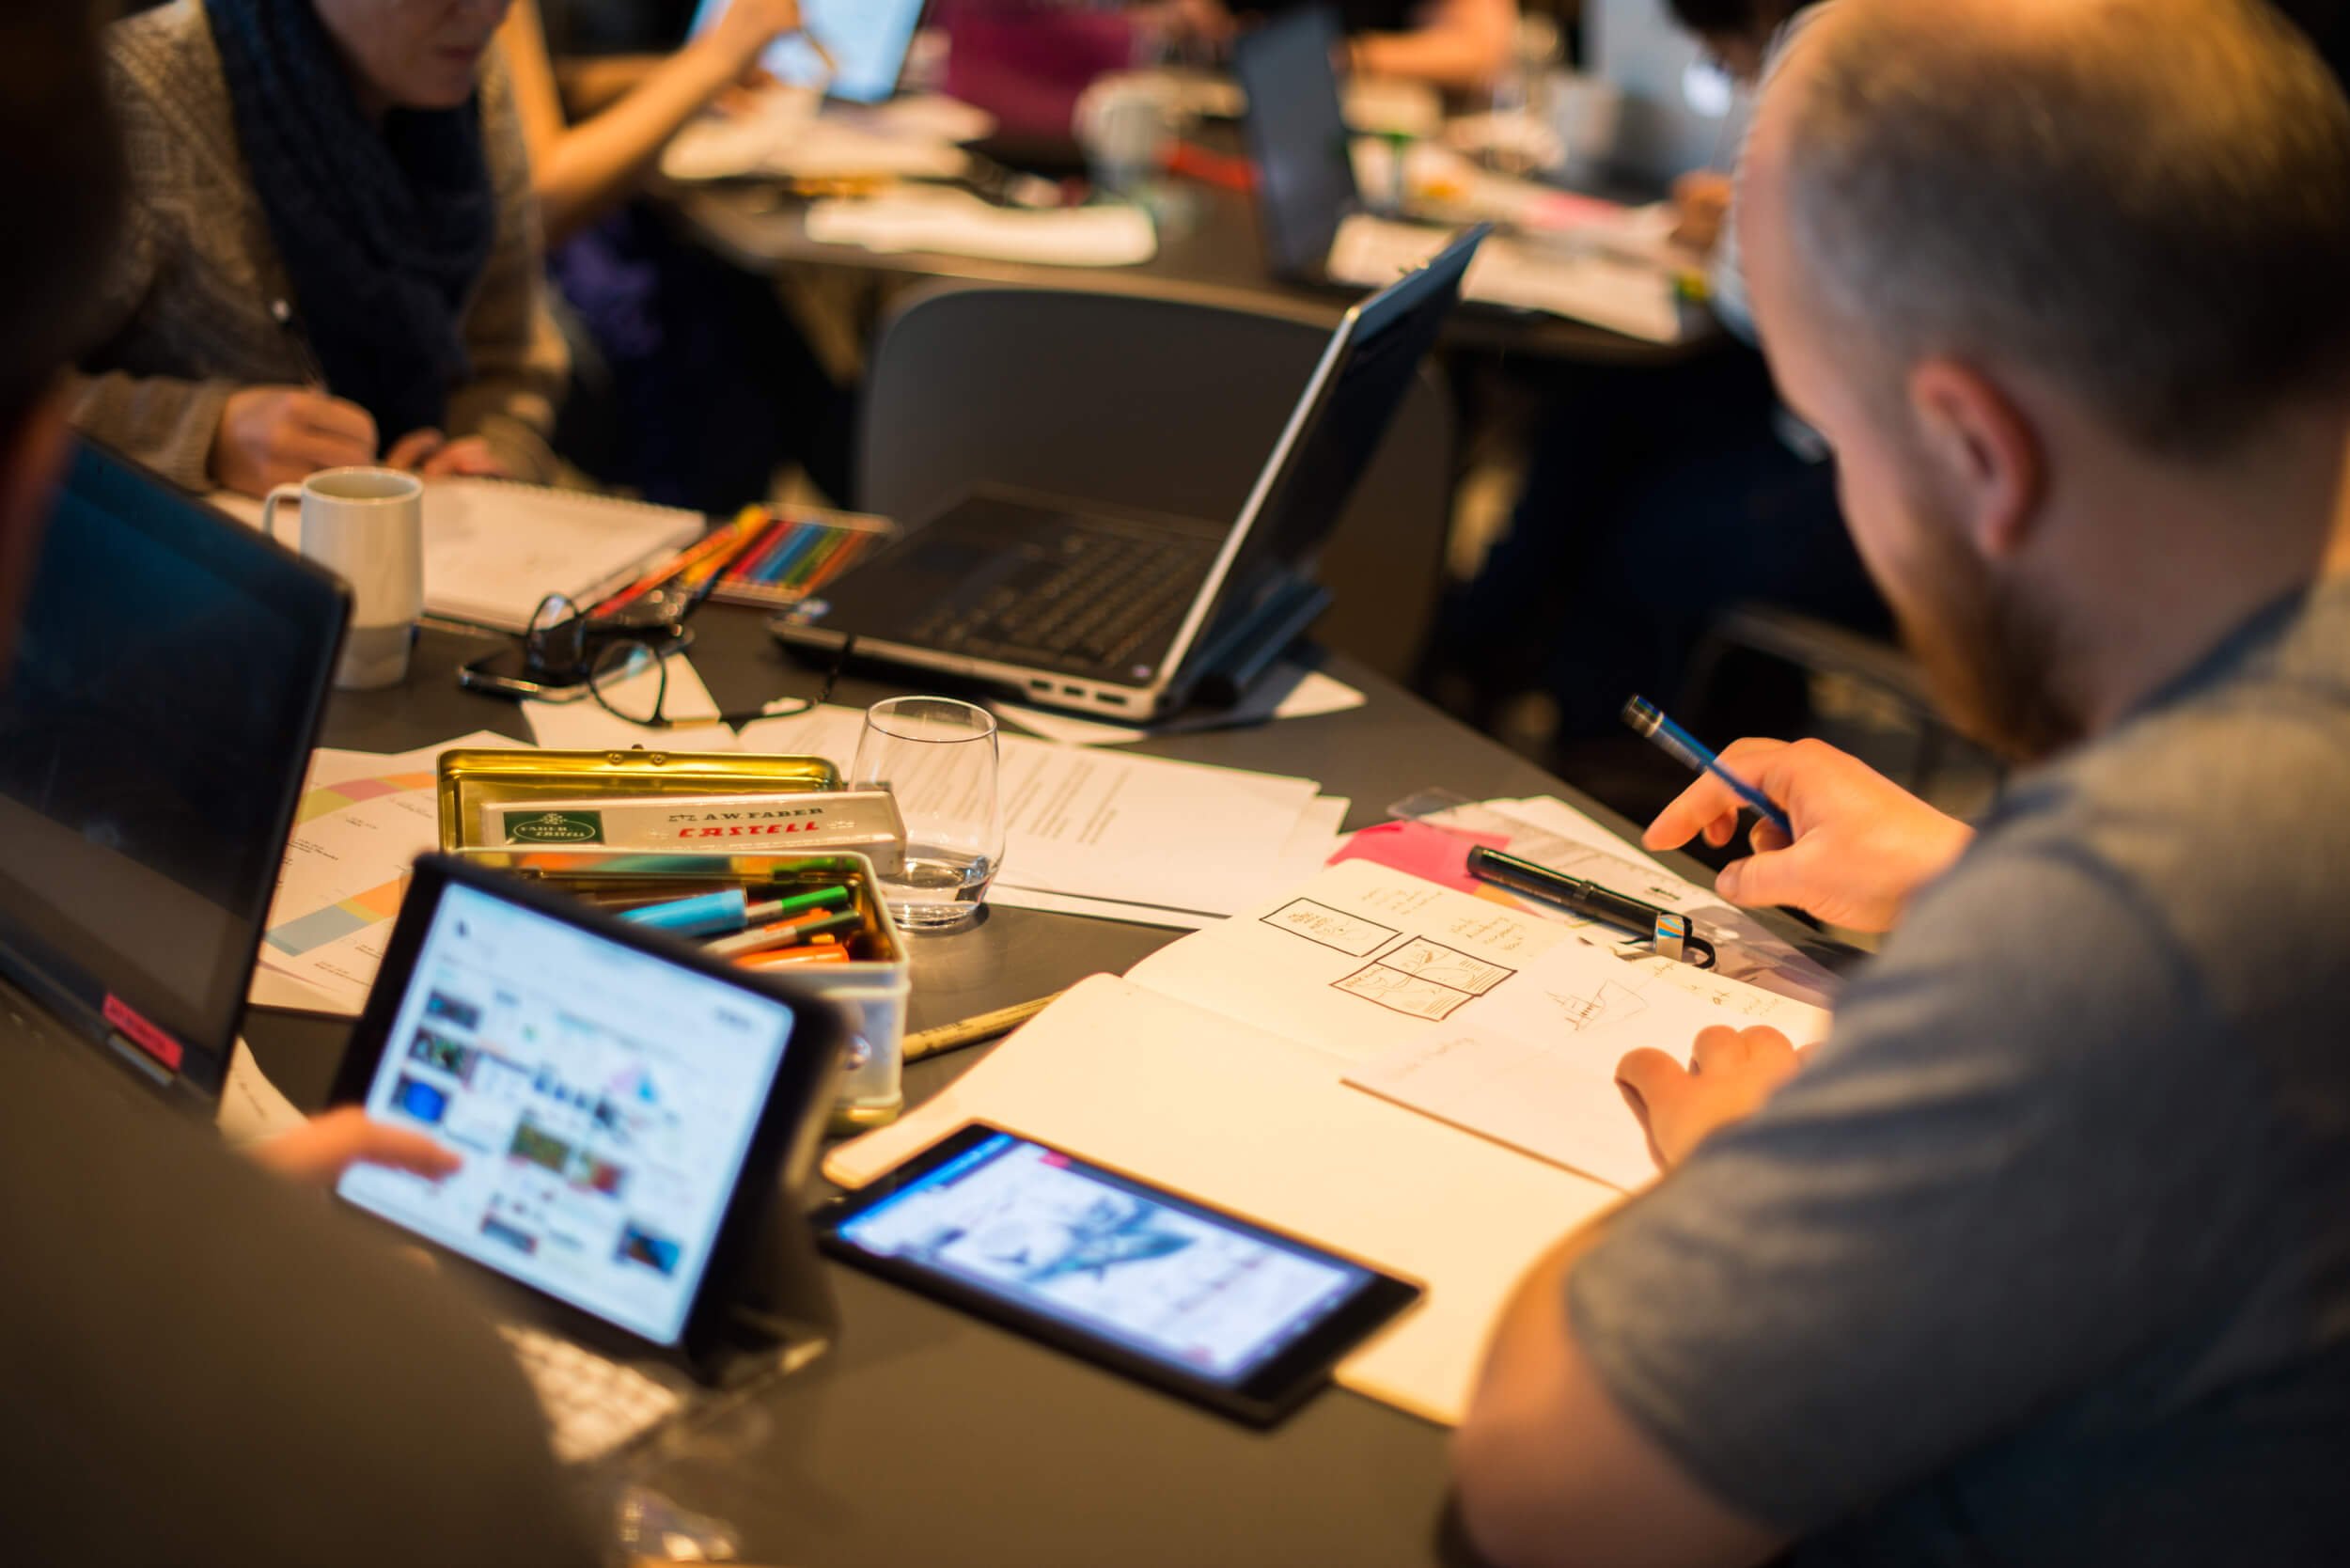
The courses we offer can last anywhere from half a day to several weeks, and can be tailored to the specific needs of the audience. These courses can include a range of teaching methods, such as lectures, group discussions, and practical exercises, to ensure maximum engagement and learning.
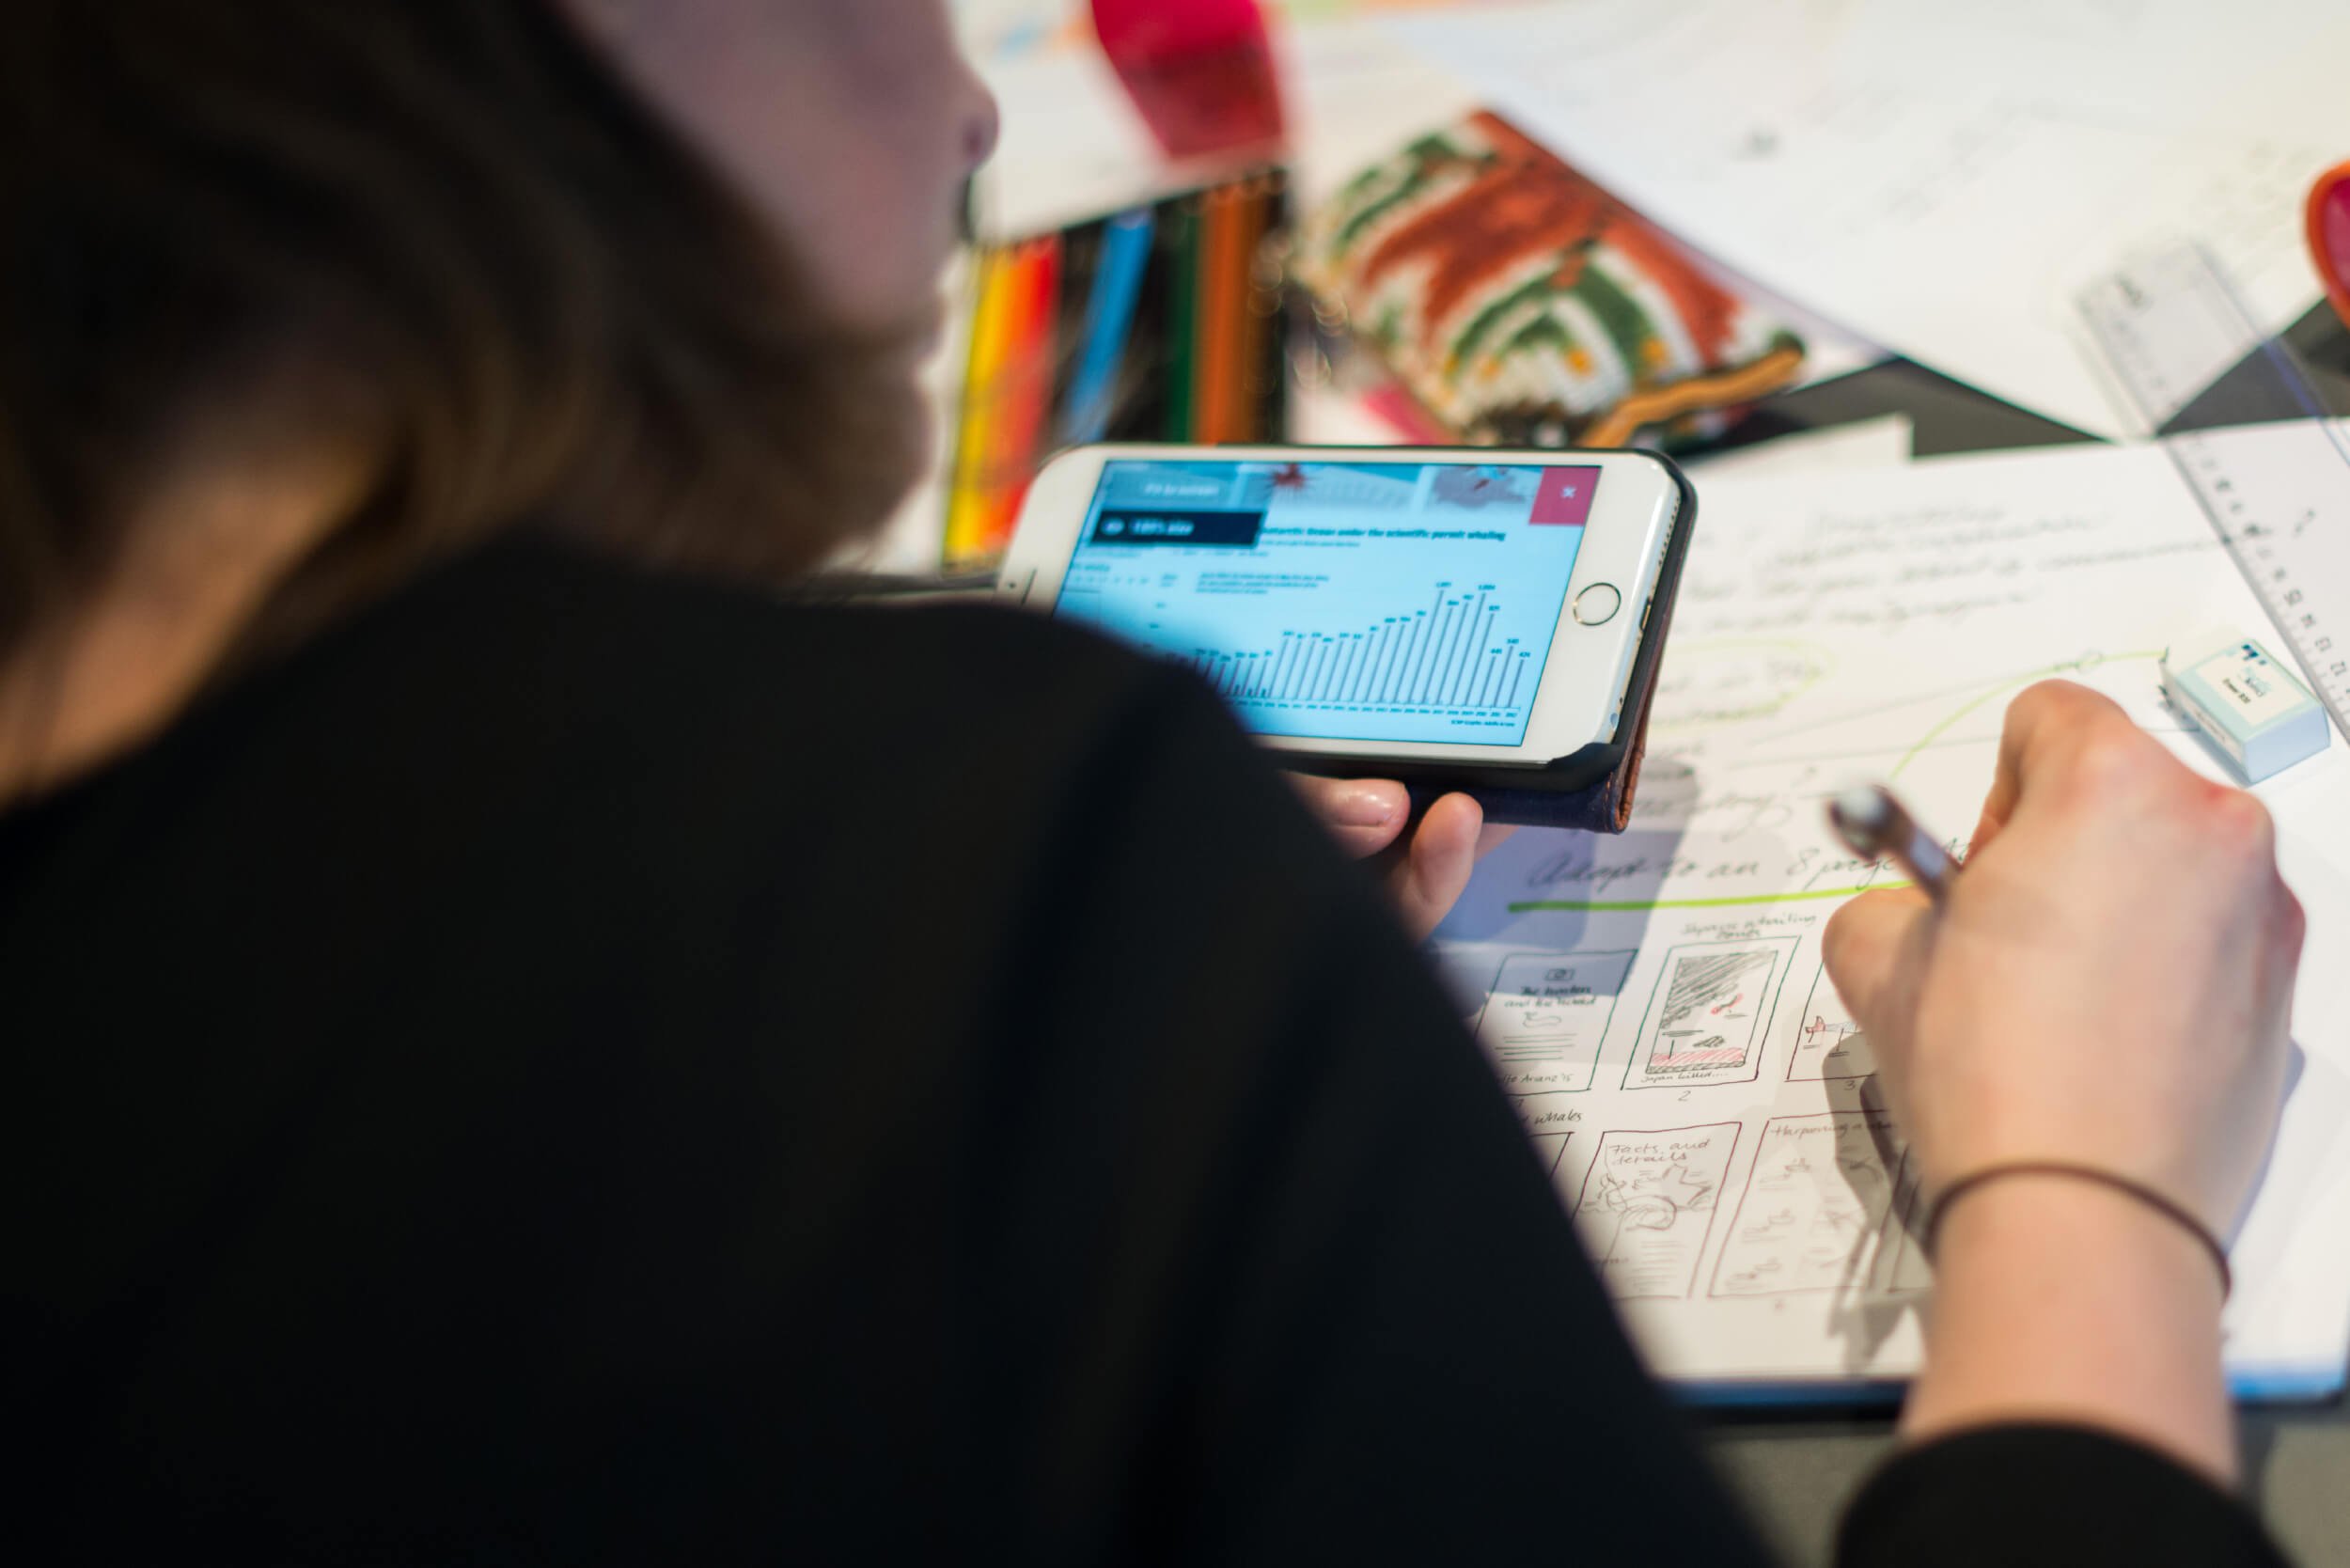
There is a strong focus on how to identify the message we need to communicate in relation to an audience, how to transform the data into powerful stories and how to choose the most appropriate tools in order to present those stories.

Teaching in organisations and universities around the world
The courses we run for scientific organisations and in universities around the world are hands-on experiences aimed at designers, non-designers, data-experts, communicators, scientists, journalists, current students or any professional working in an environment that requires presenting information in effective ways in order to capture the imagination of an audience.
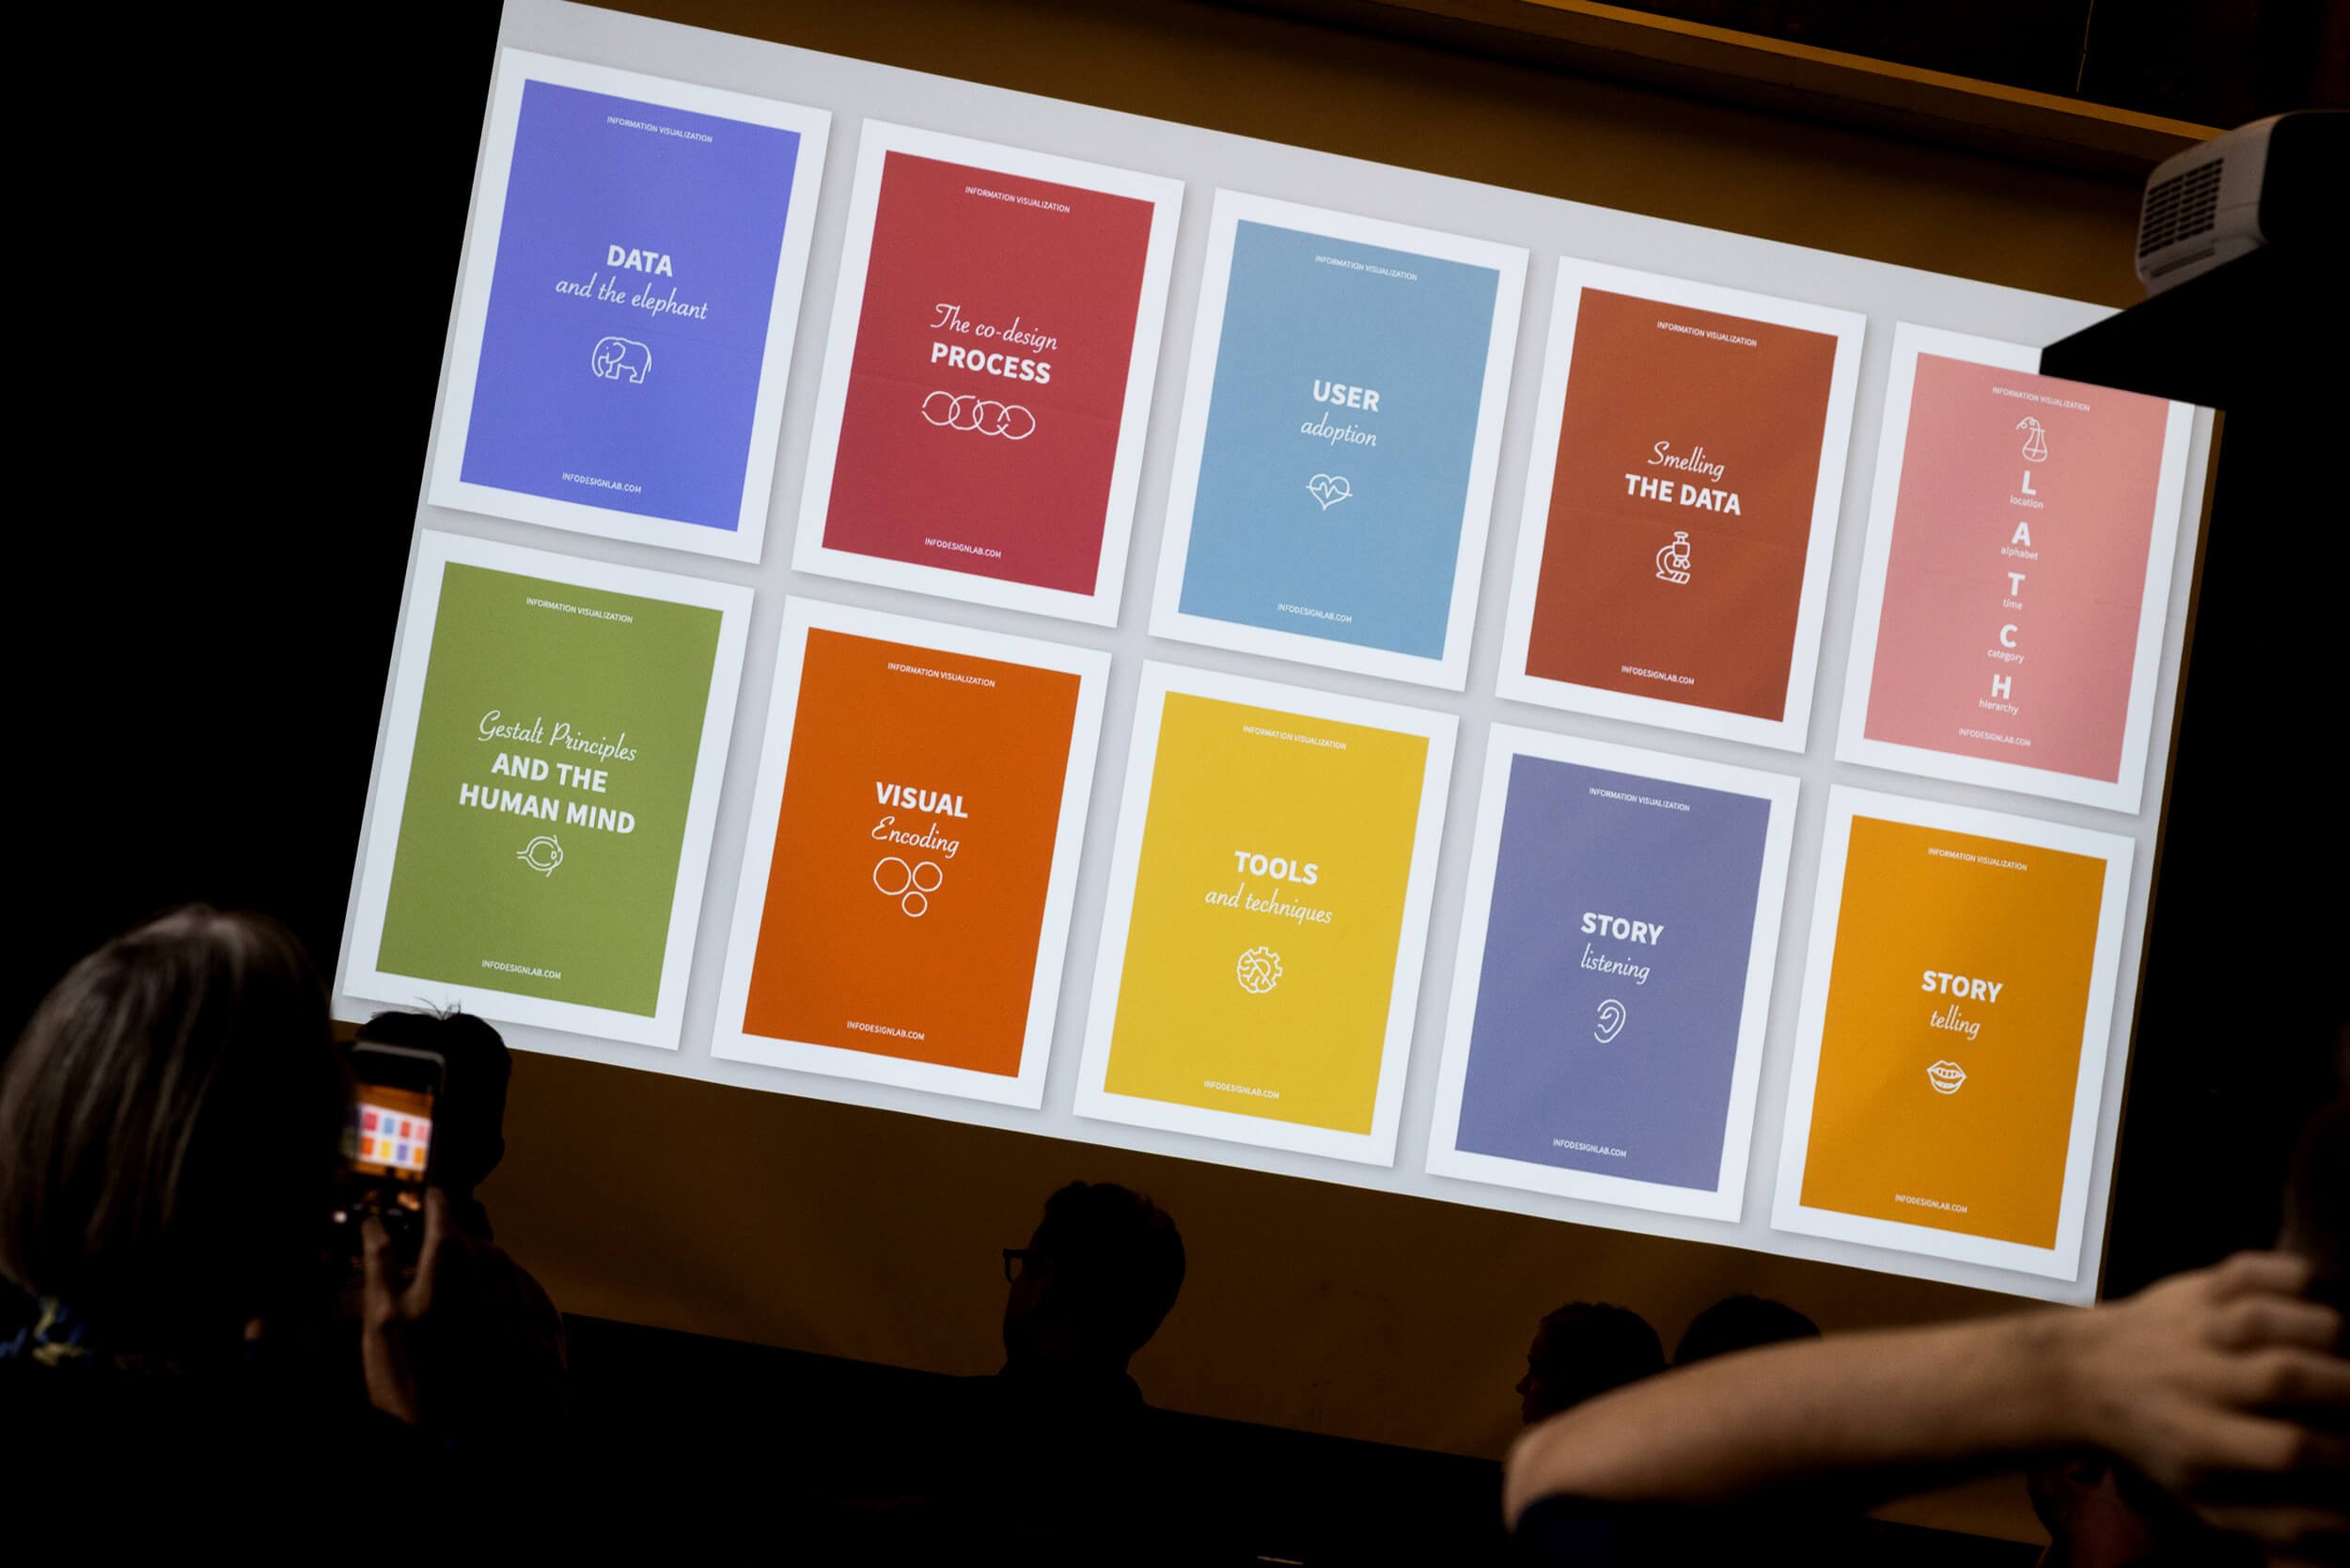
Participants are introduced to the bright world of information visualisation where the intersection of text and image, perception and cognition, beauty and function, logic and emotion enables us to create splendid visions, to reveal what hides behind the data and to address effective messages.
The length and program of these courses is set according to the goals and needs of the audience.


Teaching at Central St Martins University in London
In 2009 we established the first course in Information Design and Data Visualization at Central St Martins University in London, because we realised that more and more people without any design background need tools to communicate complex data in effective ways.
The course has been held once a year for ten years and was a hands-on experience aimed at designers, non-designers, scientists, journalists, current students or any professional working in an environment that requires presenting information in effective ways in order to capture the imagination of an audience. Participants were introduced to the bright world of information visualization where the intersection of text and image, perception and cognition, beauty and function, logic and emotion enables us to create splendid visions, to reveal what hides behind the data and to address effective messages.
Students explored how to define a project based on an initial question. They learnt how to gather and organize their data, how to identify the message they want to communicate in relation to their audience, how to transform the data into powerful stories and how to choose the most appropriate tools in order to present those stories. They realized that stories are a vehicle for making facts and numbers come alive.
Teaching at DOGA, The Norwegian Centre for Design and Architecture
In 2015 we were asked to establish a new workshop in information design and data visualisation at the Norwegian Centre for Design and Architecture (DOGA). One of the goals of this centre is to disseminate the notion of how design and architecture can impact society, individuals, government and industry. The idea of establishing a new workshop has been seen as an opportunity to work towards the centre’s mission of nurturing individuals’ skills to innovate and solve social challenges, both in the public and private sectors. The team at DOGA felt the need of starting to build a community around the subject of Information design and Data visualisation describing them as tools for understanding, sense-making, social change.
The 2-day course usually gathers about 40+ participants with very different background and skills. The course is meticulously structured as a hands-on experience aimed at a large audience of designers, communicators, scientists, researchers, current students or any professional working in an environment that requires communicating large amount of data in effective ways in order to capture the imagination of an audience. The balance between presentations, tasks and discussions sets the stage for a powerful learning experience.
Check DoGA for updates on the Information Visualisation course in Oslo.


Teaching at AHO, The Oslo School of Architecture and Design
The Oslo School of Architecture and Design (AHO) is a scientific institution providing education within architecture and industrial design, awarding the titles of PhD, Master of architecture, Master of industrial design and Master of landscape architecture. In addition, AHO offers post-graduate master degrees in urban studies and architectural heritage.
In 2016, we have been asked to tailor and run teaching modules in Information Visualisation for foundation students, BA students, MA students who work with challenges that require presenting complex information in understandable and visual ways, to present information with clarity or to solve systemic challenges.


Teaching at the Norwegian Institute of Journalism
The Norwegian Institute of Journalism is a knowledge and resource center for media practitioners with the mission of training journalists and editors, publishing text books on media and consulting media organizations.
In the past five years we have had the pleasure of running Information Design and Data Visualisation modules for journalists.
During these modules participants learn how to define a project based on an initial question or curiosity; how to gather and organize their data; how to adopt a participatory approach in data visualisation; how to use the story-listening approach in data visualisation; how to use the latest data-visualisations tool and techniques.